
The Smart Buyer’s Guide to Claims Data
Referrals drive a big share of specialty revenue, so it’s important to know not only which referrals are coming into your facilities, but also what’s happening outside your system: which competitors are seeing the most patients, who’s sending them there, and where you may be able to step in and redirect volume.
That’s where third-party claims data comes in. By pulling data from multiple sources and using a common patient identifier, the right claims data analytics solution partner can help you bridge knowledge gaps and understand the relationships driving your business – both from your employed and otherwise aligned physicians and those outside your network. They can also give you a directional view of your market share at the service line or service area level, uncover demographic and disease trends to help you plan for future demand and help you identify physicians and practices you may want to acquire.
Still, evaluating partners can be long and confusing. In more than 20 years in healthcare CRM, I worked for three companies that all said they had the best claims data — and none of them were necessarily wrong.
That’s because “best data” is subjective. It depends on things like the clearing houses your system and your market competitors and independent clinics use, the payers that participate in your market, and the methodology used by the analytics firm to infer referrals or market share. In other words, data that works well for a system in Cleveland may not be the right fit for one in Boston.
As you compare claims data partners, here are 10 questions to ask:
What types of claims data do you offer, how is it sourced and how many years are available?
💡Insight: Start by confirming whether the partner’s data supports your use cases and lets you spot trends over time. At minimum, confirm they offer at least three and preferably more years of these data in order to support share trending and referral analysis based on longitudinal patient views
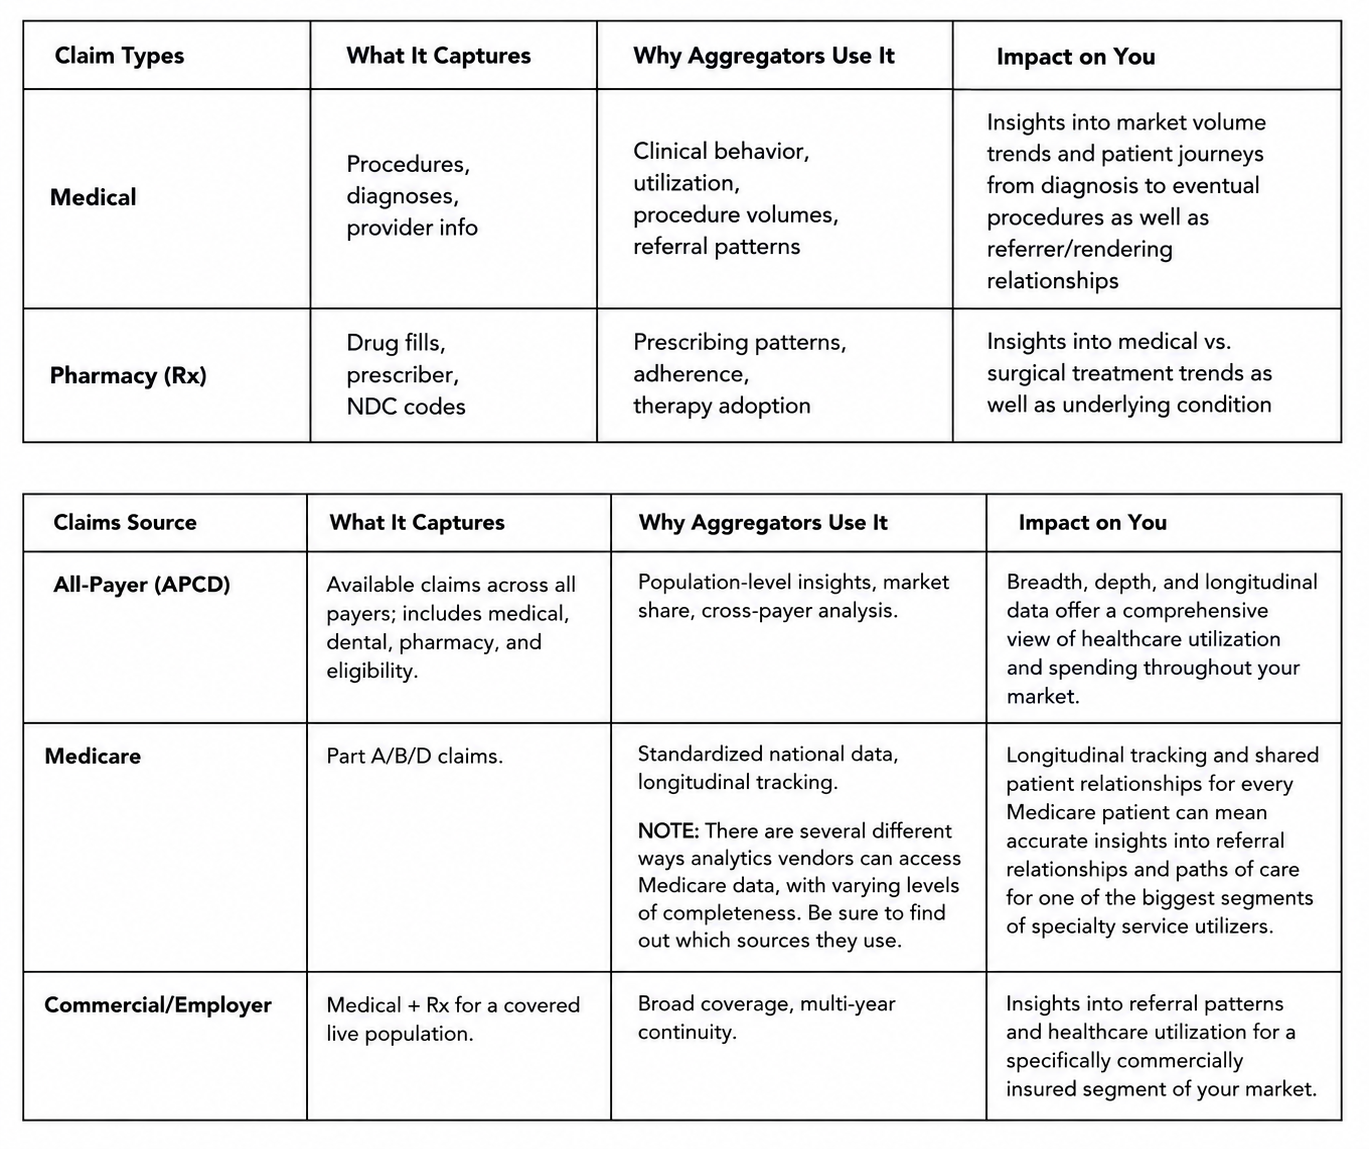
Note: Some vendors may also include Qualified Entity data from Medicare, but there are important limits on how it can be used. We’ll be posting soon with a deeper dive on claims types and sources, so stay tuned.
What are claims volumes for my primary service area?
💡Insight: To gauge coverage and accuracy in your market, you’ll want to compare their volumes to your own as a benchmark, as well as understand the claims that roll up to your competitors as an additional gut check. To do this effectively, don’t hesitate to ask for a review of:
A. Unique claims and patients by ZIP code, payer, rendering physician, and facility
B. Unique claims and patients by ZIP code, payer, and facility for a sample set of high-value physicians
C. Referral insights for a high value service line where you already have a good grasp on referral patterns. Ideally the vendor should be able to show you referring behaviors that make sense that you weren’t fully aware of.
For the cleanest read, share the CPT/HCPCS and ICD-10 codes for your service line, plus the NPIs for the referring and rendering physicians you care about.
How current and complete is the data, and how often is it refreshed?
Claims data availability in the United States can be highly variable. No vendor/entity can purchase 100% of all clinical activity or prescription activity claims occurring in the country. The density of claims availability is affected by:
1. Clearinghouses that don’t sell their claims at all
2. Payers that actively attempt to suppress their data from being available (e.g., Anthem BCBS)
3. Intentionally or data use rights-limited datasets
4. Direct-to-payer billing
5. Other effects
Every market is different when it comes to claims availability. Be cautious about broad “coverage percentage” claims, because there usually isn’t a consistent market denominator that lets anyone calculate a truly apples-to-apples coverage rate.
At a minimum, ask the vendor how many unique patients they have data for in your market, and compare that with U.S. Census figures. That gives you a rough patient coverage percentage. Just keep in mind that even if a vendor has some data for a patient, they may not have every claim for that patient for the reasons above. A second helpful measure is claims per patient: generally, the higher that number is, the more complete the view. Even then, certain practices or locations may still have very limited data, so your vendor should be able to help you understand where those gaps show up.
Insight: Data timing depends on the sources. Vendors may receive data daily, quarterly, or annually, then need time to de-duplicate and aggregate it. As a result, claims data is often one to four quarters behind and refreshed quarterly for many sources.
How do you infer referrals?
💡Insight: Referral methodologies vary, and some will fit your use cases better than others. If a new partner’s approach is very different from your current one, think through how that change could affect trust and adoption by your liaison team.
Here’s a quick guide to common methodologies. Stay tuned for a deeper dive that will be coming soon:
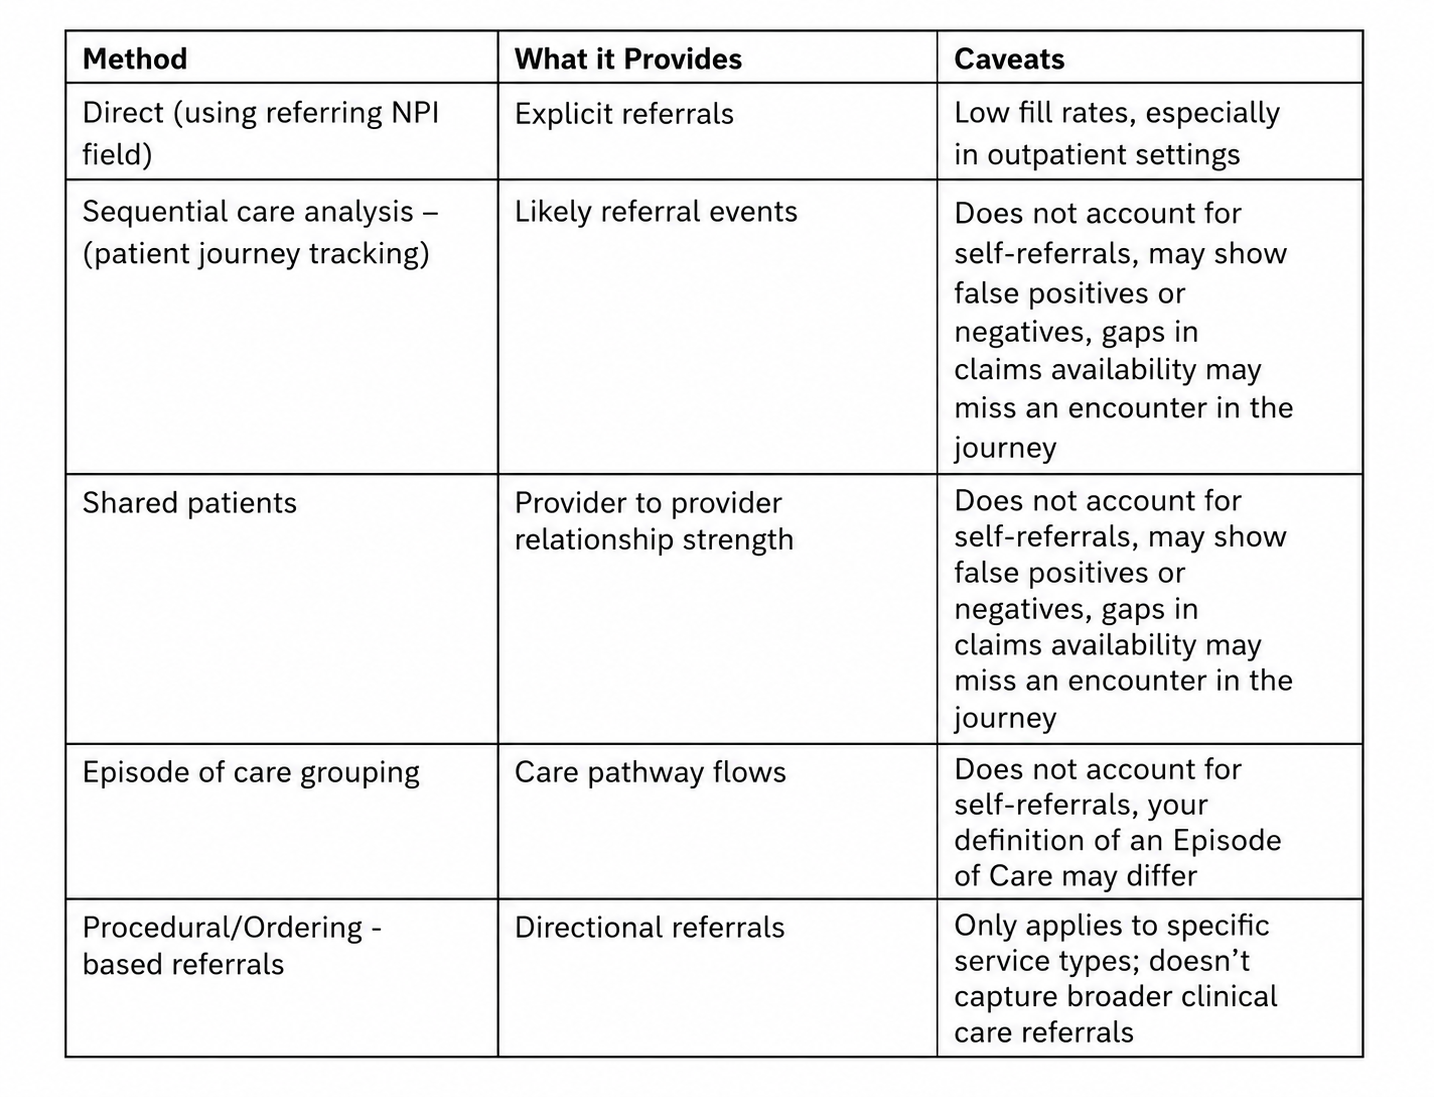
NOTE: Because all-payer claims data can vary so much, treat APCD-based referral insights as directional and ask the vendor how they validate them. If the vendor participates in the Medicare QE program, they may have access to complete Medicare Parts A and B data, which can serve as a strong benchmark for actual referral activity because of its completeness. Medicare will not apply to every use case, such as OB-GYN or pediatrics, but it is often one of the most reliable sources for understanding provider behavior. APCD can then be used to round out the picture, depending on how complete and useful it is in your specific market.
How do you link physicians to practices and care locations?
💡Insight: Practice and location data that doesn’t match what your liaison team sees in the field can quickly hurt adoption. It can also affect inferred referrals, so ask how often the vendor validates this data, how they determine a physician’s primary practice and site of care and whether this can be customized for your needs or market. See if the vendor is transparent and will discuss the possibility of inaccuracies driven by claims data quirks. Inaccuracies should not be whitewashed over, they should be explained.
How do you infer patient geography?
💡Insight: Patient origin matters, but HIPAA limits what aggregators can sell. Purchased APCD claims data is only allowed to include the first three digits of a patient’s ZIP code.
To get more granular, some aggregators infer geography and present a five-digit ZIP code. There are different ways this is done. Have them explain their methodology to make sure you’re comfortable with it.
If you provide market share, how do you calculate it?
💡Insight: There’s no true denominator for all U.S. claims, so exact market share isn’t possible. Instead, vendors may use models to fill claims data gaps and estimate market share at a broad geographic level. Just be careful when those models get applied at a five-digit ZIP or procedure level. Ask how the vendor gets from raw claims to inferred market share or referrals.
The 2024 cyberattack on one of the largest claims clearinghouse sources for data vendors changed the claims data landscape in a meaningful way. Before the attack, longitudinal share analyses were not perfect, but they were at least relatively consistent. Afterward, availability became much more variable. In general, analyses through the end of 2023 can still be trended, but be cautious about carrying those same trends into 2024 and beyond. A “new normal” for data availability emerged after the event, so ask your vendor what they did to strengthen claims volumes and what they are willing to acknowledge about the change. You need a trusted partner, not just a seller of data — and they should be able to explain the data better than you can.
How will users access the data, and what guardrails can we set?
💡Insight: Different teams need different things. Analysts may want data in Tableau or Power BI, plus access to underlying tables for SQL query-based analyses where they can then combine outputs with other data sources. . Liaisons usually want simple, clear, easy-to-use insights and may prefer analyst-curated views. IT and data governance teams will want clear ownership rules and source-of-truth hierarchies for physician and practice data that may come from multiple places, including third-party data, liaison updates, and credentialing. Make sure your prospective partner can support your organization’s needs through user-level profiles or fit-for-purpose data feeds.
What dashboards and analytics do you offer, and how can my team use them?
💡Insight: Make sure the out-of-the-box analytics fit your use cases and give the right users something actionable. Also ask where the data will live and how field users will access it. Ideally, this kind of data is stored separately and available on demand through a connector, so you can avoid extra CRM storage costs.
Can you ingest our claims data, and how will it show up in your tool?
💡Insight: This is a common request when your system’s own data is underrepresented in third-party data because of payer or clearinghouse policies.
Some vendors can ingest your data, but they’ll often keep it separate from third-party data to avoid over-weighting your claims and patient volumes against competitors.
Bottom line: claims data can be a powerful tool for understanding referrals, market dynamics, and growth opportunities — but only if you know what you’re really getting. The right partner should be able to explain where the data comes from, how it’s interpreted, how current it is, and how your teams can actually use it. Asking these questions up front will help you cut through the sales pitch and find the option that fits your market, your strategy, and the way your organization works.
Healthcare leaders don't need more dashboards. They need better answers.
The right data strategy helps you uncover growth opportunities, strengthen referral networks, improve patient access, and invest where it will have the greatest impact. Technology is only part of the equation—the real value comes from turning data into decisions.
If you're ready to build a smarter market intelligence strategy, we're here to help.
